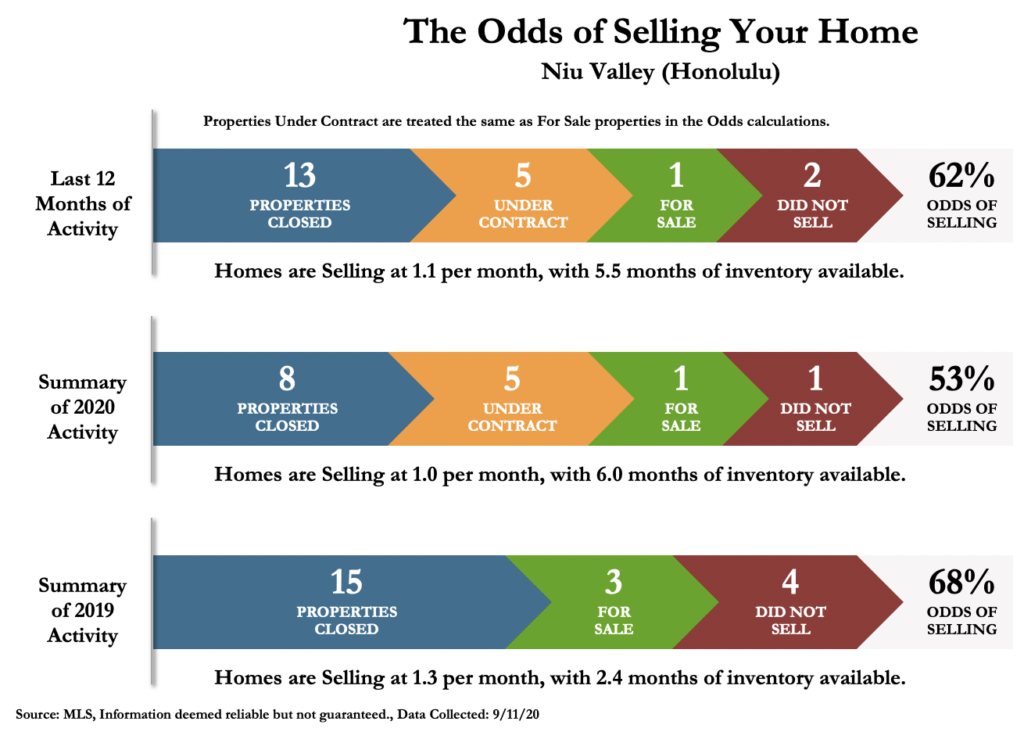
If we look at the “Odds of Selling” chart, we can see the last 2 years of sales information for Niu Valley. In 2019, the were 15 homes that sold (blue). At the end of the year, there were 3 homes for sale (green) and 4 did not sell (red). Homes were selling at and average of 1.3 per month and there was 2.4 months of inventory on the market (<6 months = seller’s market. 6 months = balanced market. >6 months = buyer’s market). In 2019, the odds of selling was 68%. In 2020, we have seen only 8 closings, up thru mid-September. There are currently 5 homes under contract and 1 home currently available in Niu Valley (215 Hawaii Loa St). In 2020, homes have been selling at 1 per month. If we include the one home for sale and the under contract properties, this gives us 6 months of supply.
Year over year, thru July 2020, we have seen supply drop in new listings(-24%) and Closed sales increase 18%. Median price is up 15% to $1,273,750 for ‘Aina Haina, Niu Valley and Kuli’ou’ou.
In the pond chart, we can see that 5 new listings came on the market, in the past 90 days. 5 properties moved across the pond, found a buyer and are in escrow. One listing, 215 Hawaii Loa, is the only one available. In the past 90 days, 5 properties sold and exited the pond to the right. Given these rates of property ingress and egress from the market, there is a monthly sales rate of 1.1/month and with 7 properties currently for sale, there is a 15% odds of selling this month.
The financial stress index has returned to “normal levels” since its highs of March, this year, around 5 points. In the chart, you can see the all time high of 9 points in October of 2008, during the financial crisis.
We can see Hawaii’s economic activity has improved since the lows of 61 points, in May. In July, we got back up to 82 points.
Tourism numbers are still cratering
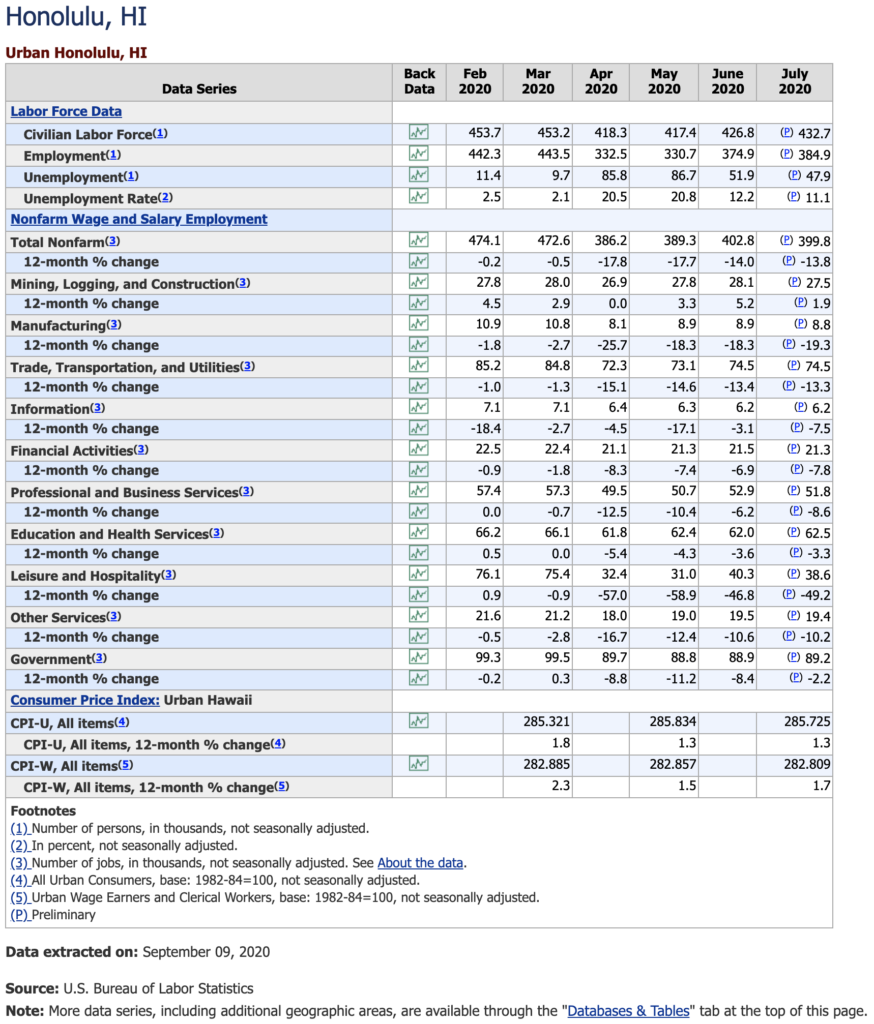
Labor numbers still depressed, especially in Leisure and Hospitality (-49.2%)